Trace List
Browse, filter, and organize your agent execution traces.
Overview
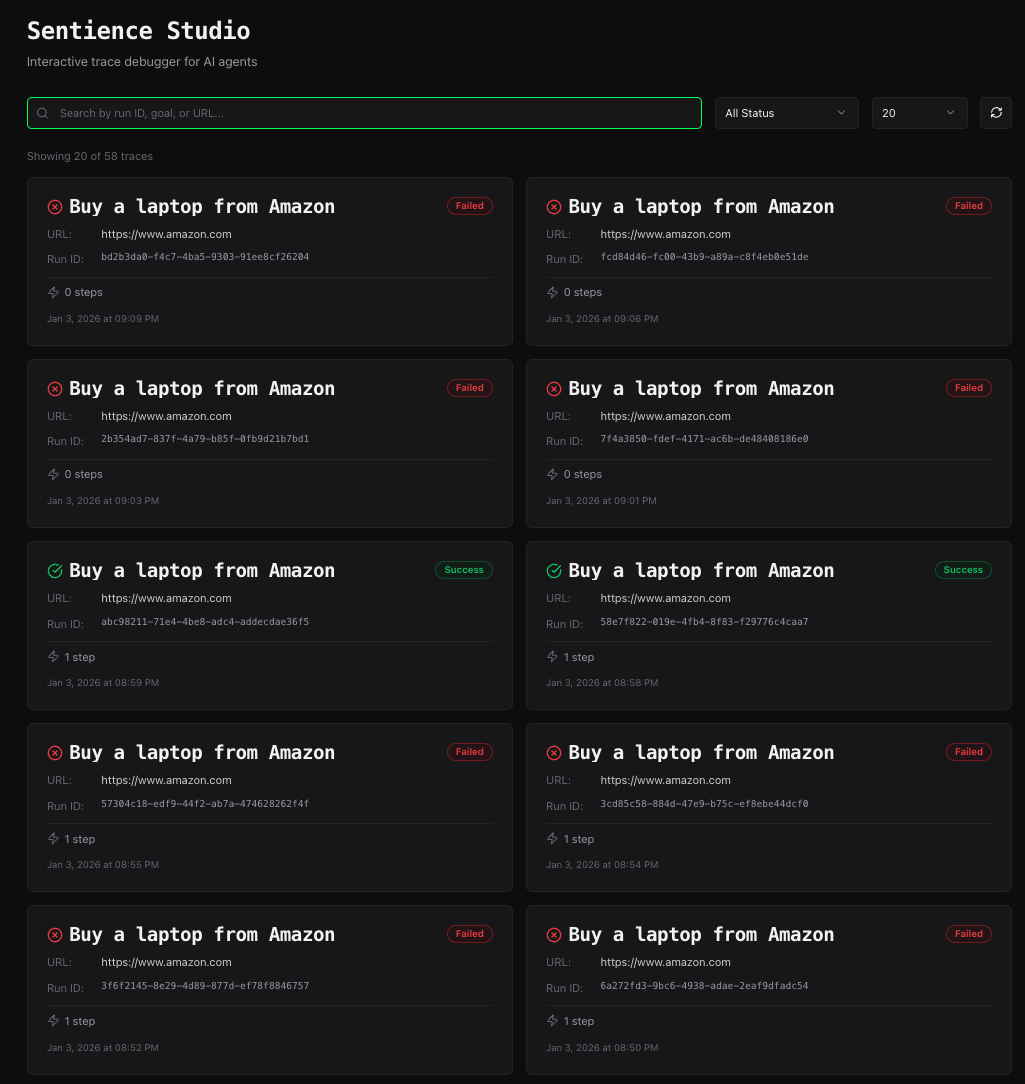
The Trace List is the landing page when you open Predicate Studio. It displays all your agent runs in a card-based interface for easy browsing and access.
Access the Trace List:
- Sign in to Predicate
- Click Studio in the navigation menu
- You'll see your trace list
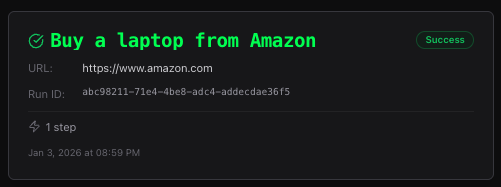
Trace Card Layout
Each trace is displayed as a card with key information:

Card Components
1. Status Icon & Badge
Top-left corner shows execution status:
Success (Green):
- ✅ Icon: Checkmark in circle
- Badge: "Success" with green background
- Meaning: All steps completed successfully
Partial (Yellow):
- ⚠️ Icon: Alert/warning symbol
- Badge: "Partial" with yellow background
- Meaning: Some steps succeeded, others failed
Failed (Red):
- ❌ Icon: X in circle
- Badge: "Failed" with red background
- Meaning: Critical failures occurred
2. Goal Title
Large, prominent text showing the agent's objective:
Buy a laptop from Amazon
This is what the agent was trying to accomplish. Clicking the card title opens the trace.
3. Start URL
Shows which website the agent started on:
URL: https://www.amazon.com
Helpful for:
- Identifying which site the trace ran on
- Grouping traces by domain
- Debugging site-specific issues
4. Run ID
Unique identifier for this execution:
Run ID: 846450db-0436-4ccf-949a-81b7c115cf3e
Use this to:
- Reference specific traces in bug reports
- Search for traces in logs
- Share traces with team members
5. Statistics Bar
Bottom section shows execution metrics:
Step Count:
⚡ 15 steps
How many steps the agent executed.
Duration:
🕐 2m 34s
Total time from start to finish. Format:
- Under 60 seconds: "45s"
- Over 1 minute: "2m 34s"
- Over 1 hour: "1h 15m"
6. Timestamp
When the trace was created:
Jan 3, 2026 at 2:45 PM
Shows in your local timezone.
Trace List Interface
Header
Top of the page shows:
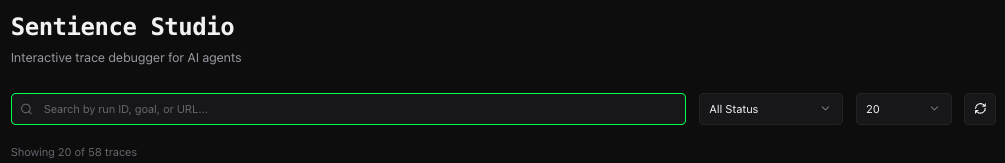
- Studio Logo - Click to return to this page
- Search Bar (future feature) - Search traces by goal, URL, or Run ID
- Filter Controls (future feature) - Filter by status, date, duration
Sorting
Traces are displayed in reverse chronological order (newest first):
- Most recent trace appears at the top
- Scroll down to see older traces
- No manual sorting controls (yet)
Pagination
For users with many traces:
- Initial load: First 20 traces
- Load more: Click "Load More" at bottom
- Infinite scroll: Automatically loads as you scroll (future feature)
Using the Trace List
Opening a Trace
Click anywhere on the trace card to open the Trace Debugger:
This navigates to:
/studio/[run_id]?goal=[encoded_goal]
The goal is passed in the URL to ensure it displays correctly even before the full trace loads.
Quick Scanning
The card layout makes it easy to quickly scan for specific traces:
Find failed runs:
- Look for red badges
- Red ❌ icons stand out visually
Find recent runs:
- Check timestamps at bottom of cards
- Newest traces are at top
Find specific sites:
- Scan the URL field
- Group mentally by domain
Find long runs:
- Check duration (🕐 icon)
- Longer runs may need optimization
Understanding Trace Status
Success Traces
Indicators:
- ✅ Green checkmark icon
- "Success" badge (green)
- All steps completed
What it means:
- Agent achieved its goal
- All actions executed successfully
- All verifications passed
- No critical errors
Common for:
- Well-tested flows
- Simple, deterministic tasks
- Stable website structures
Partial Traces
Indicators:
- ⚠️ Yellow warning icon
- "Partial" badge (yellow)
- Mixed success/failure steps
What it means:
- Agent made progress but didn't fully succeed
- Some actions worked, others failed
- May have completed some objectives but not all
Common for:
- Multi-step processes with failures mid-way
- Flaky website elements
- Timeout issues
- Dynamic content problems
Action needed:
- Review failed steps in Trace Debugger
- Identify failure patterns
- Update agent logic or selectors
Failed Traces
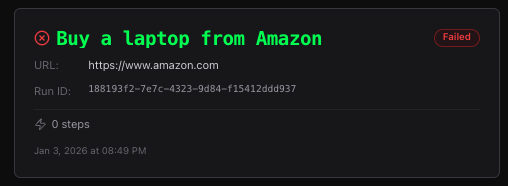
Indicators:
- ❌ Red X icon
- "Failed" badge (red)
- Critical failures
What it means:
- Agent encountered blocking errors
- Could not complete the goal
- Major issues prevented progress
Common for:
- Site structure changes
- Wrong URL or starting point
- Missing elements
- Network errors
- Authentication issues
Action needed:
- Open in Trace Debugger immediately
- Check first failed step
- Identify root cause
- Fix and re-run
Trace Organization Tips
Since there's no built-in filtering yet, here are manual organization tips:
Mental Filtering
By Status:
- Scan for color: Green = ignore (working), Red/Yellow = investigate
By Date:
- Top section = today's runs
- Middle section = this week
- Bottom section = older runs
By Goal:
- Group similar goals mentally
- Look for repeated patterns
By Duration:
- Quick runs (<30s) = Simple tasks
- Medium runs (30s-5m) = Normal automation
- Long runs (>5m) = Complex flows or performance issues
Naming Conventions
When creating traces, use clear, descriptive goals:
Good goal names:
✓ Buy a laptop from Amazon
✓ Submit contact form on example.com
✓ Search for "python tutorial" on Google
✓ Add item to cart and checkout
Bad goal names:
✗ Test
✗ Debug run
✗ Untitled Run
✗ Run 1
Clear goals make the Trace List much easier to navigate.
Trace Storage & Limits
Storage Duration
Traces are stored based on your plan tier:
- Hobby: Not available
- Builder: 30 days
- Pro: 90 days
- Teams: 180 days
- Enterprise: Custom retention
After this period, traces are automatically deleted.
Storage Limits
Number of traces stored:
- Builder: Up to 100 traces
- Pro: Up to 500 traces
- Teams: Up to 2,000 traces
- Enterprise: Custom limits
When you reach the limit, oldest traces are deleted first.
Trace Size
Individual trace size depends on:
- Number of steps - More steps = larger trace
- Screenshot quality - 80% JPEG compression
- Page complexity - More DOM elements = larger snapshots
Typical sizes:
- Small trace (5 steps): ~2-5 MB
- Medium trace (20 steps): ~10-20 MB
- Large trace (100 steps): ~50-100 MB
Common Use Cases
1. Debugging Failed Runs
Workflow:
- Open Trace List
- Look for red "Failed" badges
- Click the failed trace
- Jump to first failed step
- Analyze what went wrong
2. Comparing Runs
Workflow:
- Identify two similar traces (same goal)
- Open first trace in tab 1
- Open second trace in tab 2
- Compare step-by-step execution
- Find differences
3. Monitoring Production
Workflow:
- Check Trace List daily
- Scan for yellow/red badges
- Investigate any failures
- Track success rate over time
4. Auditing Agent Behavior
Workflow:
- Filter by date range (manually scroll)
- Review traces for specific period
- Export important traces to PDF
- Archive for compliance
Future Features
Planned enhancements to the Trace List:
Search
Search by goal, URL, Run ID, or date range
Filters
Filter by:
- Status (Success/Partial/Failed)
- Date range
- Duration
- Steps count
- URL domain
Sorting
Sort by:
- Date (newest/oldest)
- Duration (longest/shortest)
- Steps (most/least)
- Status
Bulk Actions
- Select multiple traces
- Delete selected
- Export selected to PDF
- Archive selected
Tags
Tag traces for organization:
- Production
- Testing
- Bug Report
- CI/CD
Keyboard Shortcuts
Navigate the Trace List efficiently:
| Shortcut | Action |
|---|---|
Enter | Open selected trace |
↓ | Move to next trace (future) |
↑ | Move to previous trace (future) |
/ | Focus search bar (future) |
f | Open filter menu (future) |
Performance Tips
Loading Speed
For faster Trace List loading:
- Clear browser cache periodically
- Use modern browsers (Chrome, Edge, Firefox, Safari)
- Stable internet connection recommended
Large Trace Lists
If you have hundreds of traces:
- Page load may be slower
- Scroll gradually to load more
- Consider manually archiving old traces (export to PDF)
Next Steps
- Open a Trace: Learn about the Trace Debugger →
- Analyze Steps: Master the Detail Panel →
- Enable Tracing: Set up SDK tracing →
- Need Help?: Check Troubleshooting →