Detail Panel
Deep dive into step-by-step execution data with the Detail Panel.
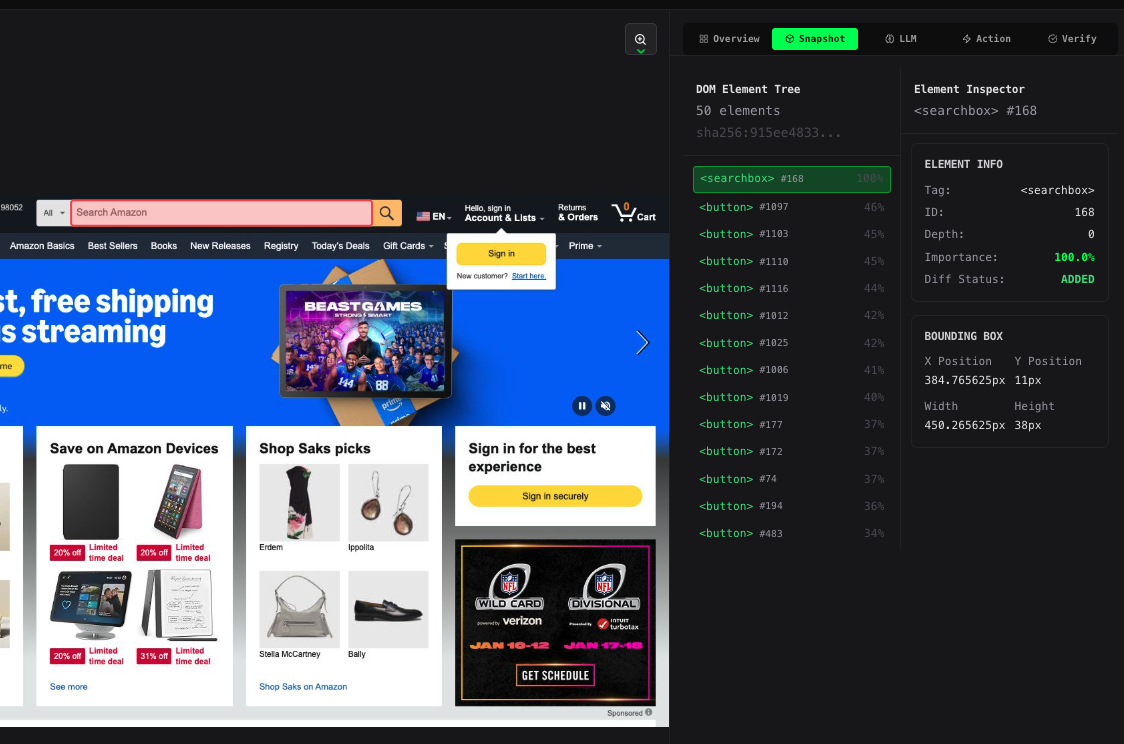
Overview
The Detail Panel is the right sidebar (35% of screen) in the Trace Debugger that shows comprehensive information about the currently selected step.
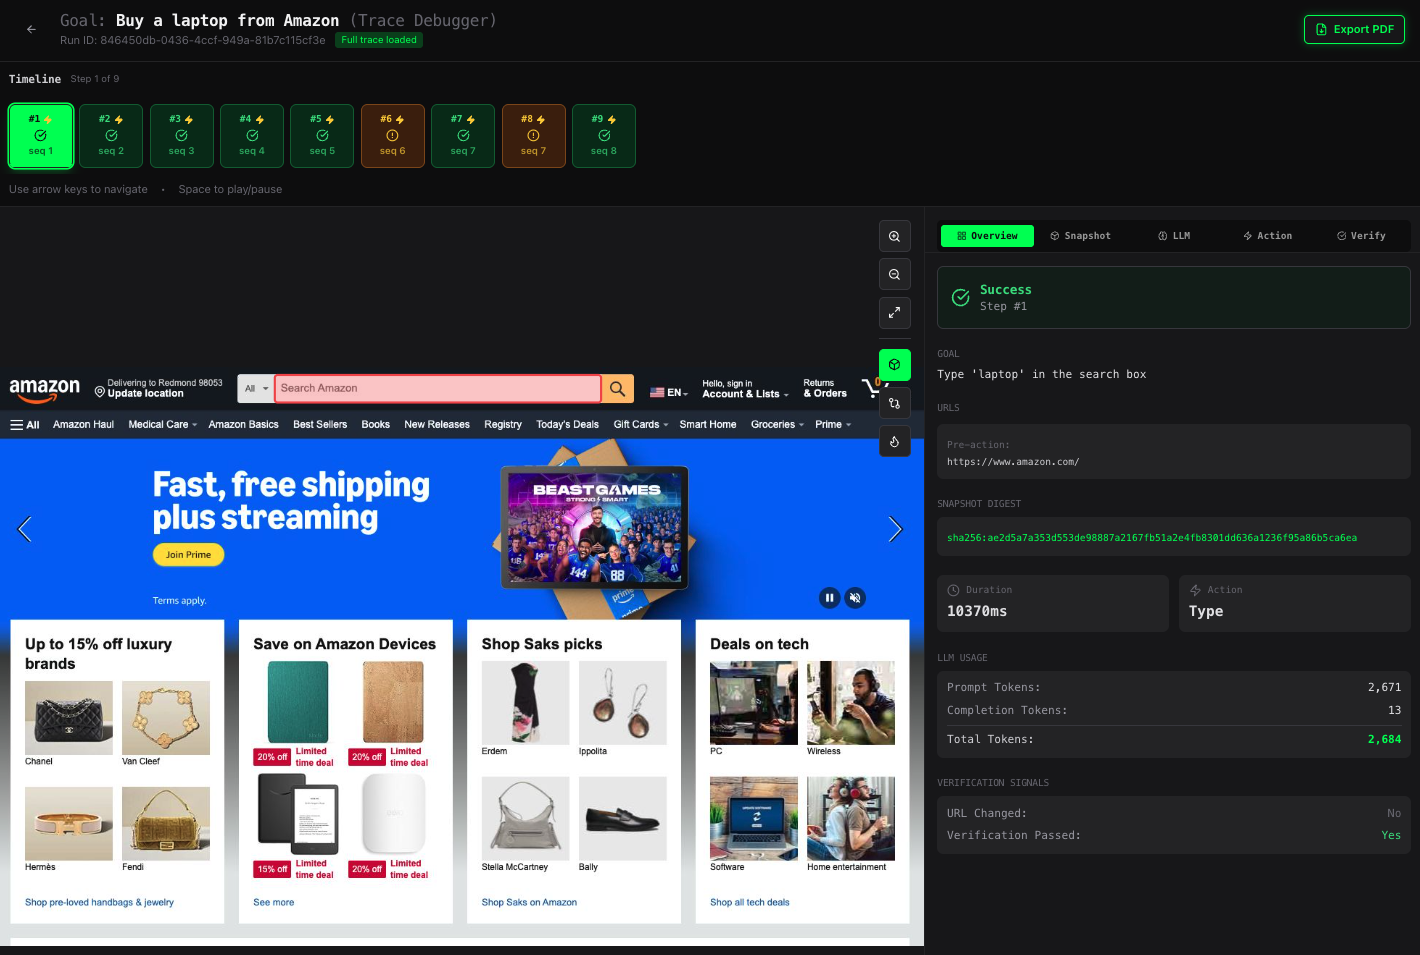
It provides everything you need to understand:
- What the agent was trying to do
- What action it executed
- What the LLM decided
- Whether it succeeded or failed
- How long it took
- Why it failed (if applicable)
Panel Sections
The Detail Panel is organized into collapsible sections for easy navigation.
Step Information
Step Header
Shows at the very top:
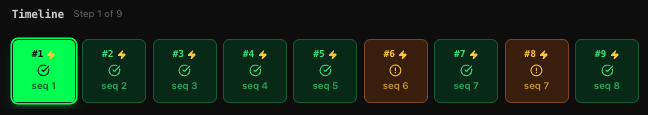
- Step number - "Step 3 of 15"
- Status badge - Success, Partial, or Failed
- Timestamp - When this step executed
Goal
The specific goal for this step:
Type 'laptop' in the search box
This is NOT the overall run goal (e.g., "Buy a laptop from Amazon"), but rather the immediate objective for this individual step.
Action Summary
One-line description of what happened:
✓ Typed "laptop" into element #168 (search input)
Or if it failed:
✗ Failed to click element #42 (button not found)
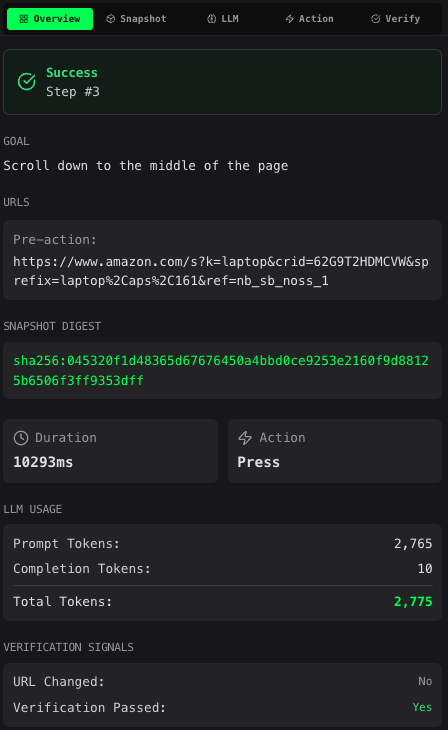
URLs Section
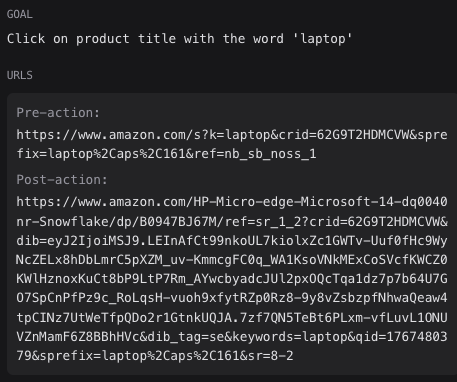
Shows the webpage state before and after the action:
Pre-Action URL
The URL before the action executed:
https://www.amazon.com/s?k=laptop&crid=62G9T2HDMCVW&sprefix=laptop%2Caps%2C161&ref=nb_sb_noss_1
Post-Action URL
The URL after the action executed:
https://www.amazon.com/HP-Micro-edge-Microsoft-14-dq0040nr-Snowflake/dp/B0947BJ67M/ref=sr_1_2?crid=62G9T2HDMCVW&dib=eyJ2IjoiMSJ9.LEInAfCt99nkoUL7kiolxZc1GWTv-Uuf0fHc9WyNcZELx8hDbLmrC5pXZM_uv-KmmcgFC0q_WA1KsoVNkMExCoSVcfKWCZ0KWlHznoxKuCt8bP9LtP7Rm_AYwcbyadcJUl2pxOQcTqa1dz7p7b64U7GO7SpCnPfPz9c_RoLqsH-vuoh9xfytRZp0Rz8-9y8vZsbzpfNhwaQeaw4tpCINz7UtWeTfpQDo2r1GtnkUQJA.7zf7QN5TeBt6PLxm-vfLuvL1ONUVZnMamF6Z8BBhHVc&dib_tag=se&keywords=laptop&qid=1767480379&sprefix=laptop%2Caps%2C161&sr=8-2
What to look for:
- URL changed - Navigation occurred (expected for clicks, form submissions)
- URL unchanged - No navigation (expected for typing, scrolling)
- Unexpected change - May indicate a problem (popup redirect, error page)
LLM Response Section
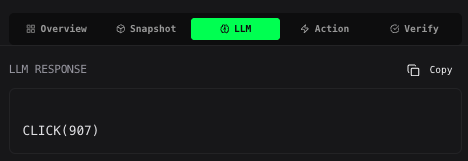
Shows the raw output from the language model that decided what action to take.
Response Text
The exact text the LLM generated:
TYPE(168, "laptop")
This is the instruction the agent follows. Format varies by agent type:
- PredicateAgentAsync:
ACTION(element_id, parameters) - Custom agents: May use different formats
Response Hash
SHA-256 hash of the response for caching:
sha256:2428758f8403d6f4c489184402e04a2e072e301ce6d43a6288fb9737c02bfe04
Why it matters:
- Determinism - Same hash means same LLM response
- Caching - Responses can be cached by hash
- Debugging - Compare hashes across runs to detect non-determinism
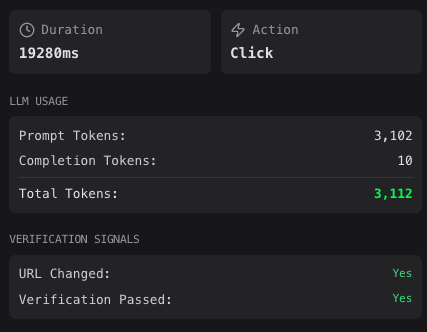
Token Usage
LLM token consumption for this step:
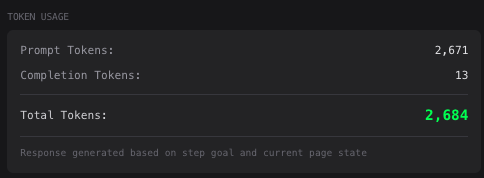
Prompt Tokens: 2,671
Completion Tokens: 13
Total Tokens: 2,684
What to look for:
- High prompt tokens - Large page content or many elements
- High completion tokens - Complex reasoning or verbose output
- Total cost - Approximate cost for this step
Execution Details Section
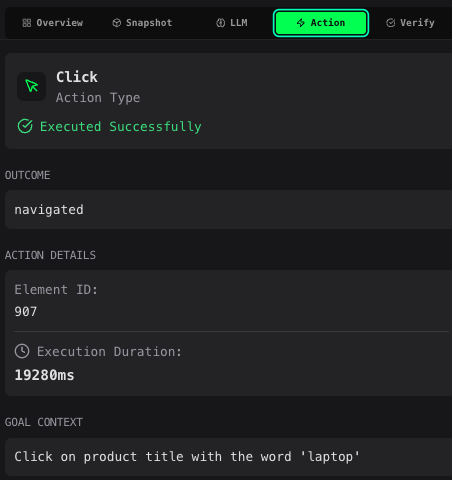
Shows exactly what happened when the action was executed.
Action Type
The type of action:
click- Clicked an elementtype- Typed text into an inputpress- Pressed a keyboard keyscroll- Scrolled the pagenavigate- Navigated to a URL
Target Element
Information about the target element (for click/type actions):
Element ID: 168
Element Type: input
Bounding Box: { x: 280, y: 120, width: 450, height: 40 }
Bounding box shows the exact position and size of the element on the page.
Action Parameters
Specific details for the action:
For type actions:
Text: "laptop"
For click actions:
Click Coordinates: (505, 140)
For press actions:
Key: "Enter"
For scroll actions:
Direction: down
Amount: 500px
Execution Outcome
What happened when the action executed:
Success outcomes:
dom_updated- Page DOM changed (expected)navigation- Page navigated to new URLno_change- Action completed but page didn't change
Failure outcomes:
element_not_found- Target element doesn't existelement_not_visible- Element exists but isn't visibletimeout- Action took too longerror- JavaScript error occurred
Duration
How long the action took to execute:
Duration: 10,370 ms (10.37 seconds)
What's normal:
click: 100-2000mstype: 500-5000ms (depends on text length)navigate: 1000-10000ms (depends on page load)scroll: 100-500ms
What's slow:
click: >5000ms (page loading issue)type: >10000ms (slow input handling)navigate: >30000ms (network issues)
Error Details
If the action failed, shows the error:
Error: Element #42 not found in DOM. The element may have been removed
or the page structure changed.
Verification Section
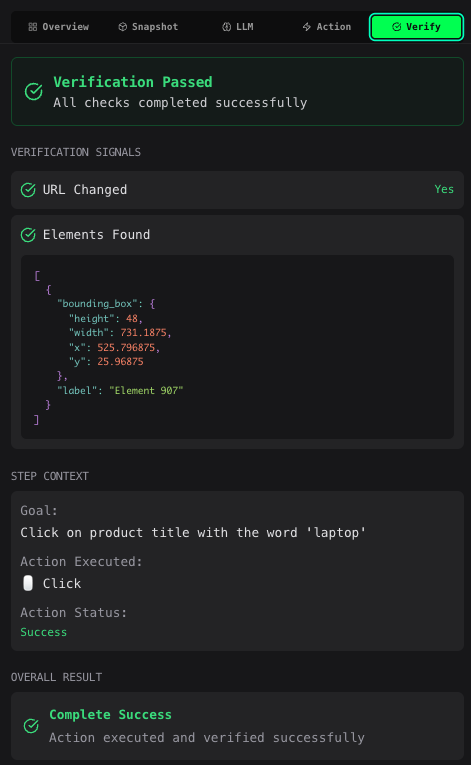
Shows whether the action achieved its intended goal.
Verification Status
Overall verification outcome:
- ✅ Passed - Action achieved desired result
- ❌ Failed - Action did not achieve desired result
Verification Signals
Specific checks that were performed:
Common signals:
url_changed:
✓ URL changed (expected for navigation)
✗ URL did not change (expected change)
dom_mutation:
✓ DOM was modified (expected for interactions)
✗ No DOM changes detected
element_visible:
✓ Target element is visible
✗ Element is hidden or removed
error_detected:
✗ JavaScript error occurred on page
✓ No errors detected
timeout:
✗ Operation timed out
✓ Completed within timeout
Custom Signals
Some agents may provide custom verification signals:
shopping_cart_updated: true
item_count_increased: true
price_displayed: true
Performance Metrics Section
Additional performance data:
Step Duration Breakdown
LLM Call: 2,450 ms
Action Execution: 10,370 ms
Verification: 1,200 ms
Total: 14,020 ms
Network Activity
Requests: 8
Data Transferred: 1.2 MB
Memory Usage
Heap Size: 45 MB
DOM Nodes: 1,247
Understanding Step Status
The status badge at the top tells you the overall outcome:
Success (Green)
Both action execution AND verification passed:
✓ Action: Succeeded
✓ Verification: Passed
Example:
- Goal: Click "Add to Cart" button
- Action: Successfully clicked element #42
- Verification: Shopping cart count increased
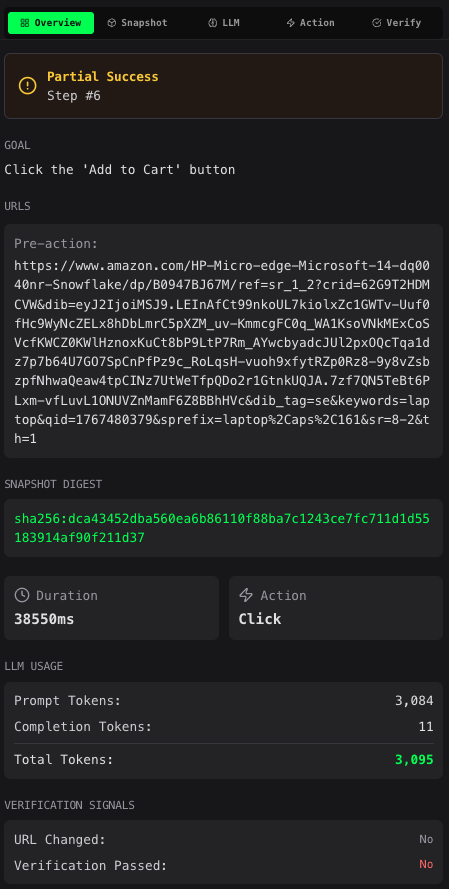
Partial (Yellow)
Action succeeded BUT verification failed:
✓ Action: Succeeded
✗ Verification: Failed
Example:
- Goal: Click "Search" button
- Action: Successfully clicked element #15
- Verification: Expected navigation, but URL didn't change
Common causes:
- Action worked but page didn't respond as expected
- Timing issues (verification checked too soon)
- Dynamic content loaded differently than expected
Failed (Red)
Action execution failed:
✗ Action: Failed
- Verification: Not performed (action failed)
Example:
- Goal: Type "laptop" in search box
- Action: Element #168 not found
- Verification: N/A (can't verify failed action)
Common causes:
- Element not found on page
- Element not clickable (hidden, covered)
- Timeout waiting for element
- JavaScript error
Reading Execution Data
Successful Step Example
Step 3: Type 'laptop' in search box
✓ Success

URLs:
  Pre:  https://www.amazon.com/
  Post: https://www.amazon.com/ (unchanged)

LLM Response:
  TYPE(168, "laptop")
  Tokens: 1,257

Execution:
  Action: type
  Element: #168 (input)
  Text: "laptop"
  Outcome: dom_updated
  Duration: 10,370 ms

Verification:
  ✓ Passed
  Signals:
    ✓ dom_mutation: true
    ✓ element_visible: true
    ✓ error_detected: false
What this tells you:
- Agent decided to type "laptop" into element #168
- Action succeeded and updated the DOM
- Verification confirmed the input is visible and no errors occurred
- Took 10.37 seconds (normal for typing with rendering)
Failed Step Example
Step 7: Click "Add to Cart" button
✗ Failed

URLs:
  Pre:  https://www.amazon.com/dp/B08N5WRWNW
  Post: https://www.amazon.com/dp/B08N5WRWNW (unchanged)

LLM Response:
  CLICK(42)
  Tokens: 1,445

Execution:
  Action: click
  Element: #42 (button)
  Outcome: element_not_found
  Duration: 5,000 ms (timeout)
  Error: Element #42 not found in DOM

Verification:
  - Not performed (action failed)
What this tells you:
- Agent tried to click element #42 ("Add to Cart" button)
- Element was not found on the page
- Action timed out after 5 seconds searching for it
- Verification couldn't run because action failed
Next steps:
- Check screenshot - Is the button visible?
- Check bounding box overlay - Was the wrong element targeted?
- Check URL - Did the page change unexpectedly?
- Check previous step - Did something remove the button?
Partial Success Example
Step 5: Click "Search" button
⚠ Partial

URLs:
  Pre:  https://www.amazon.com/
  Post: https://www.amazon.com/ (unchanged)

LLM Response:
  CLICK(89)
  Tokens: 1,123

Execution:
  ✓ Action: click
  Element: #89 (button)
  Outcome: dom_updated
  Duration: 1,250 ms

Verification:
  ✗ Failed
  Signals:
    ✗ url_changed: false (expected true)
    ✓ dom_mutation: true
    ✓ element_visible: true
What this tells you:
- Agent clicked element #89 successfully
- DOM was updated (something changed on page)
- But URL didn't change (expected navigation to search results)
- Button is still visible after click
Possible issues:
- Wrong button clicked (might be a filter, not search)
- Search requires pressing Enter (not just clicking button)
- JavaScript error prevented navigation
- Verification expectation was wrong
Common Debugging Patterns
Pattern 1: Element Not Found
Symptoms:
- Status: Failed
- Outcome:
element_not_found - Duration: ~5000ms (timeout)
Check:
- View screenshot - Is element visible?
- Check previous step - Did page structure change?
- Enable bounding box overlay - Was correct element targeted?
- Check URL - Are we on the right page?
Solutions:
- Update element selector
- Add wait before action
- Check for dynamic content loading
Pattern 2: Action Succeeded, Nothing Happened
Symptoms:
- Status: Partial
- Execution: Succeeded
- Verification: Failed (no URL change, no DOM mutation)
Check:
- Enable diff overlay - Did anything change?
- Check LLM response - Was correct action chosen?
- Check element - Is it the right target?
- Check verification signals - What failed?
Solutions:
- Wrong element clicked
- Need to press Enter after typing
- Need to wait for page response
- Verification expectations need adjustment
Pattern 3: Slow Execution
Symptoms:
- Duration: >10,000ms
- Status: May succeed or fail
- Multiple retries visible
Check:
- Check duration breakdown - Where is time spent?
- Check network activity - Large downloads?
- Check screenshot - Page loading spinner visible?
- Compare to similar steps - Is this step always slow?
Solutions:
- Increase timeout
- Wait for specific element instead of fixed delay
- Optimize page load (if you control the site)
- Check network connection
Next Steps
- Navigate Traces: Learn about the Trace List →
- Visual Analysis: Return to Trace Debugger →
- Enable Tracing: Set up SDK tracing →
- Need Help?: Check Troubleshooting →