Getting Started with Predicate Studio
Learn how to access Studio, view your first trace, and navigate the interface.
Accessing Predicate Studio
Plan Requirements
Predicate Studio is available on Builder tier and above:
- ✅ Builder - Full Studio access
- ✅ Pro - Full Studio access
- ✅ Teams - Full Studio access
- ✅ Enterprise - Full Studio access
- ❌ Hobby - Upgrade required
Need to upgrade? Visit your Dashboard and click "Upgrade Plan" to access Studio.
Accessing Studio
- Sign in to your Predicate account
- Click Studio in the navigation menu
- You'll see the Trace List showing all your agent runs
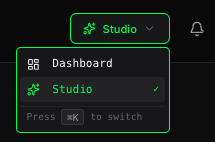
After signing in, access Studio from the main navigation bar. Press
Cmd + K(Mac) orCtrl + K(Windows) to switch between Dashboard and Studio.
Your First Trace
What is a Trace?
A trace is a complete record of an agent execution. It contains:
- Every step the agent took
- Screenshots at each decision point
- LLM responses and reasoning
- Action executions and results
- Verification outcomes
- Performance metrics
Think of it as a "recording" of your agent's entire run that you can replay and inspect.
Viewing the Trace List
When you first open Studio, you'll see the Trace List:
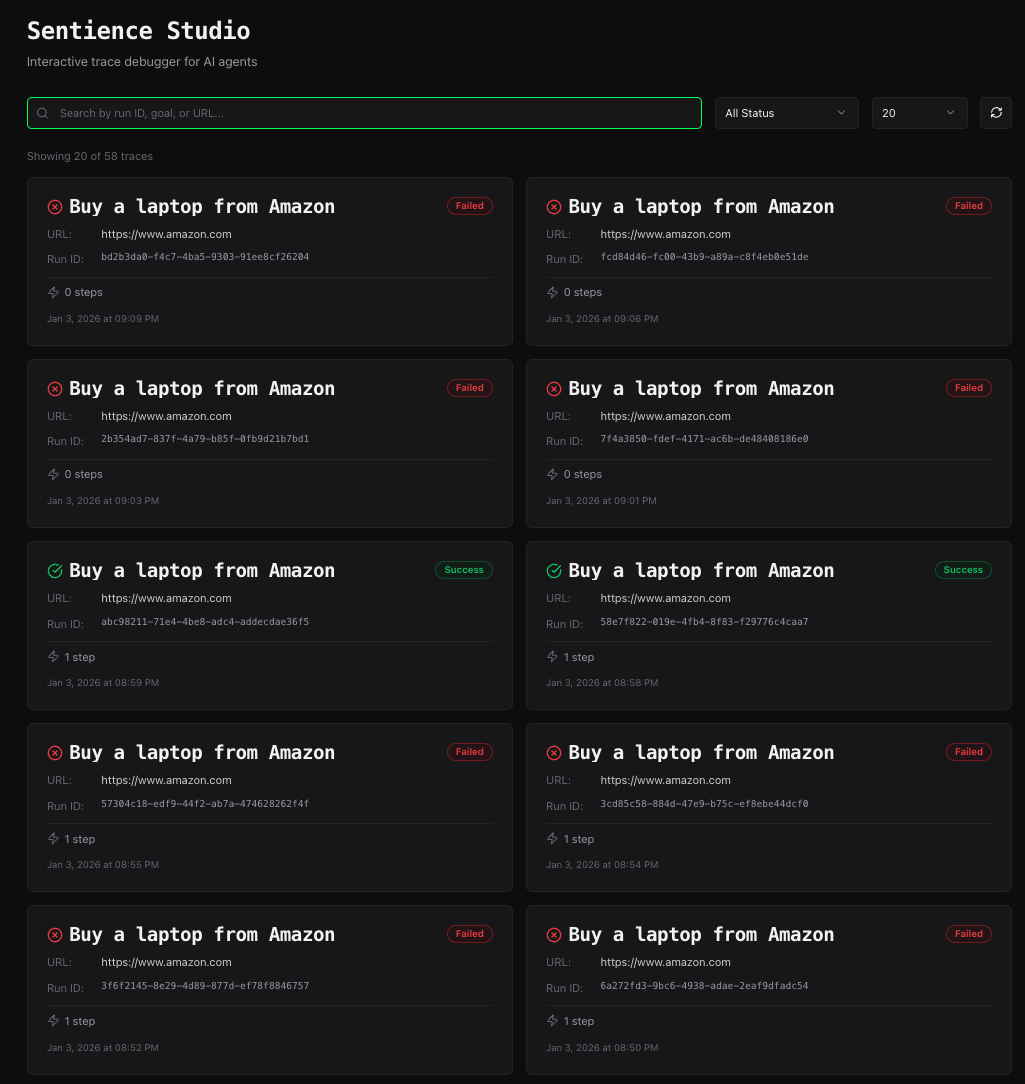
Each trace card shows:
- Goal - What the agent was trying to accomplish
- Status Badge - Success (green), Partial (yellow), or Failed (red)
- URL - The starting website
- Run ID - Unique identifier for this execution
- Stats - Number of steps and duration
- Timestamp - When the run occurred
Opening a Trace
Click any trace card to open the Trace Debugger:
The Trace Debugger is where you'll spend most of your time analyzing agent behavior.
Understanding the Interface
Trace Debugger Layout
The Trace Debugger has three main sections:
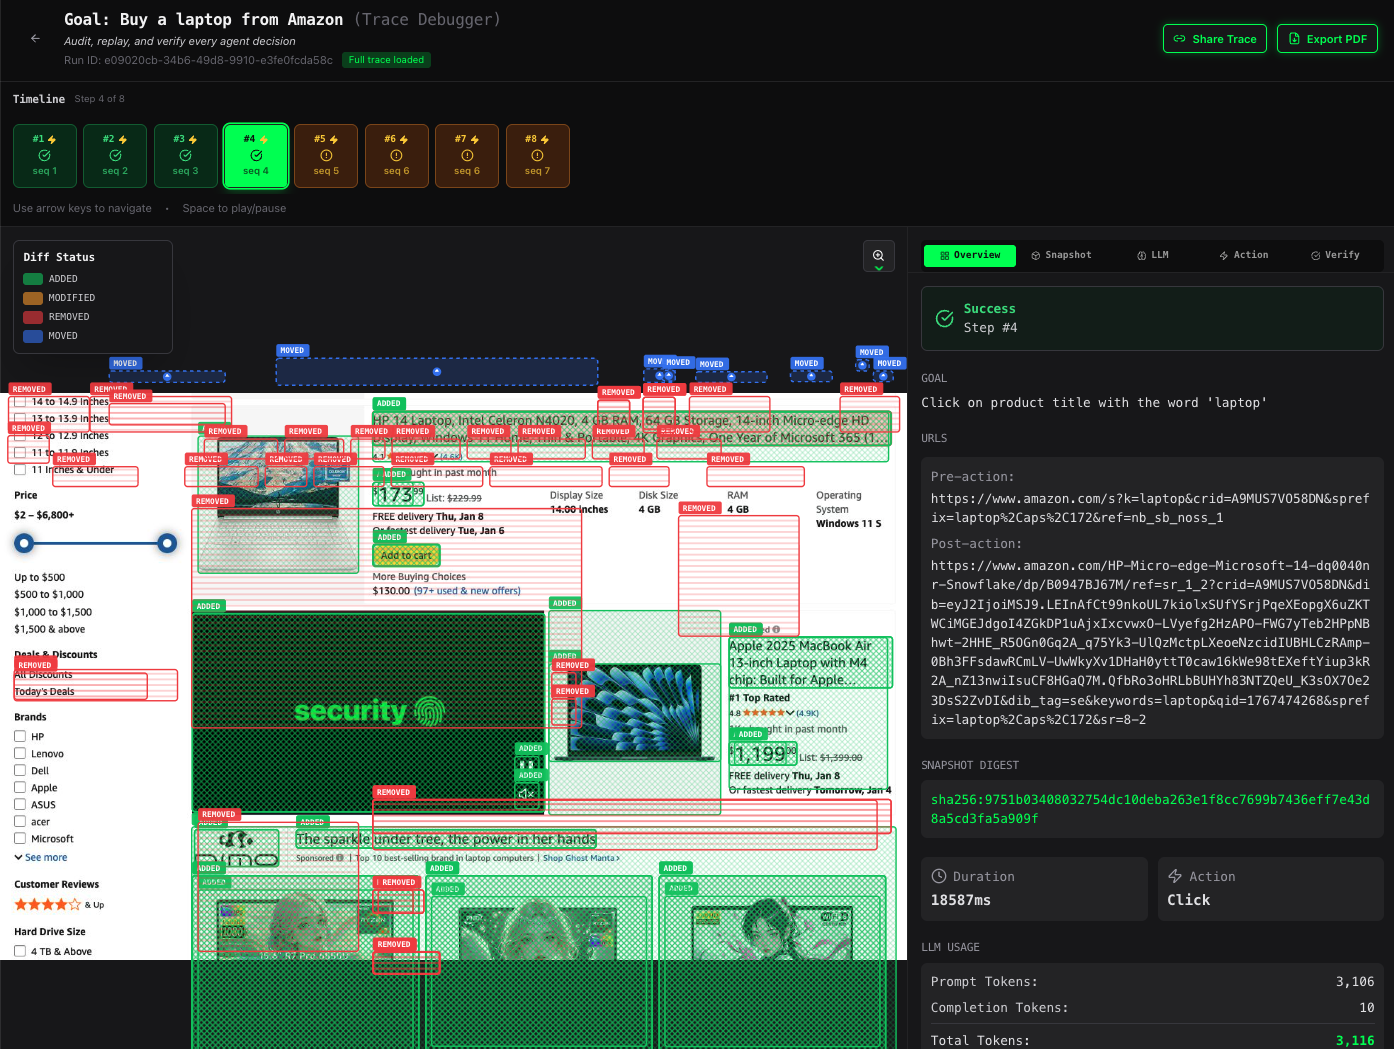
1. Timeline (Top)
Shows all steps in the execution as a horizontal timeline:
- Green bars = Successful steps
- Yellow bars = Partial success (action succeeded but verification failed)
- Red bars = Failed steps
- Click any step to jump to it
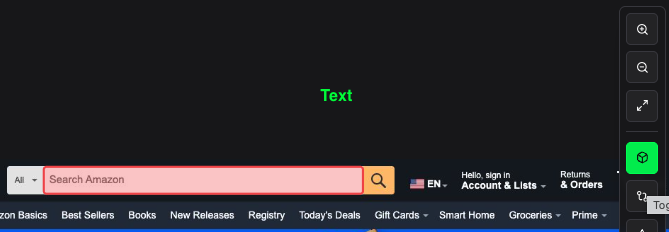
2. Screenshot Viewer (Left - 65%)
Displays the webpage screenshot for the current step:
- See exactly what the agent "saw"
- Visual overlays show element interactions
- Toggle different visualization modes
3. Detail Panel (Right - 35%)
Shows detailed information about the current step:
- Step goal and action
- LLM response
- Execution details
- Verification results
- Performance metrics
Navigation Controls
At the bottom of the screen, you'll find playback controls:
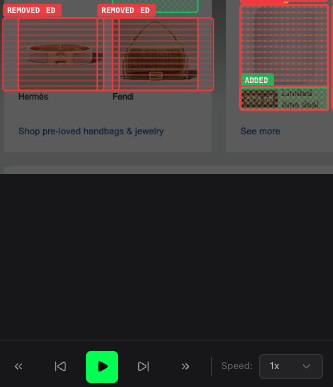
- Previous/Next - Step backward or forward
- Play/Pause - Auto-play through steps
- Speed Control - Adjust playback speed (0.5x, 1x, 2x, 4x)
- Step Counter - Shows current step number
Keyboard Shortcuts
Speed up your workflow with keyboard shortcuts:
| Key | Action |
|---|---|
Space | Play/Pause |
← | Previous step |
→ | Next step |
Home | Jump to first step |
End | Jump to last step |
Your First Analysis
Let's walk through analyzing a simple trace:
Step 1: Select a Trace
From the Trace List, click a trace with a Failed or Partial status badge.
Step 2: Find the Failure Point
Look at the timeline - red or yellow bars indicate problems and the lightning icon shows agent actions
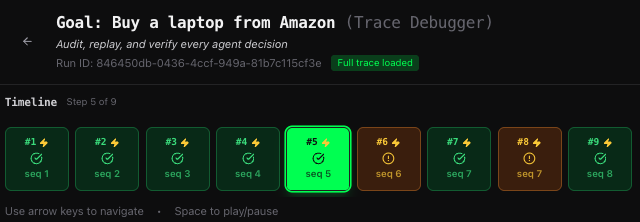
Click the failed step to inspect it.
Step 3: Review the Screenshot
Look at the screenshot viewer:
- What was on the page at this moment?
- Was the element the agent tried to interact with visible?
- Were there any popups or overlays blocking interaction?
Step 4: Check the Detail Panel
Scroll through the detail panel:
- Goal - What was the agent trying to do?
- Action - What action did it attempt?
- Execution - Did the action succeed or fail?
- Verification - Why did verification fail?
Step 5: Understand the Failure
Common failure patterns:
- Element not found - The agent couldn't locate the target element
- Action succeeded, verification failed - The action executed but didn't produce expected results
- Timeout - The page took too long to respond
- Navigation error - The page navigated unexpectedly
Visualization Modes
Studio provides three visualization overlays to help you understand agent behavior:
Bounding Box Overlay
Shows which elements the agent interacted with:
- Green boxes = Successfully interacted elements
- Red boxes = Failed interactions
- Click the Box icon to toggle
Diff Overlay
Highlights what changed between steps:
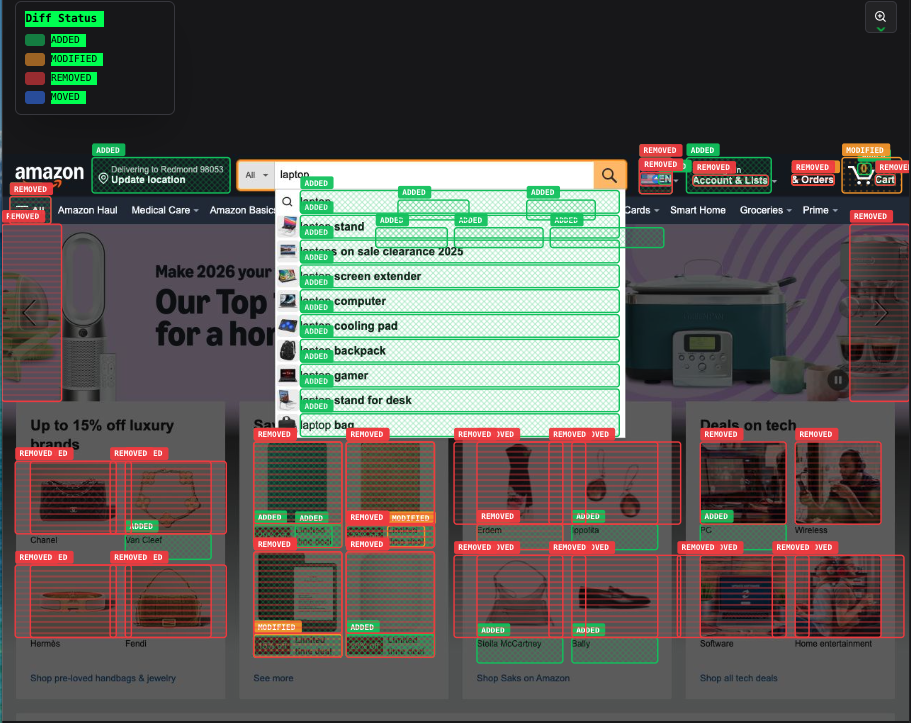
- Green = Elements added
- Red = Elements removed
- Yellow = Elements modified
- Click the Diff icon to toggle
Heatmap Overlay
Shows element importance scores:
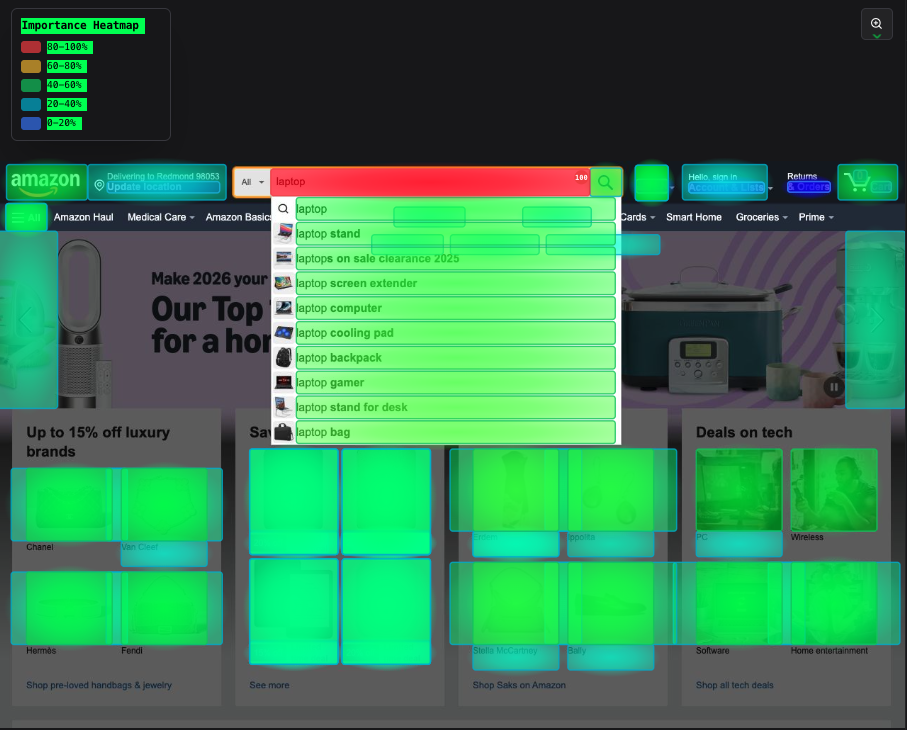
- Bright colors = High importance (agent focused here)
- Dim colors = Low importance
- Click the Heatmap icon to toggle
Next Steps
Now that you understand the basics:
- Deep Dive: Learn about the Trace Debugger interface →
- Analysis: Master the Detail Panel →
- Enable Tracing: Set up tracing in your code →
Quick Tips
- Use keyboard shortcuts to navigate faster
- Toggle overlays to see different aspects of the page
- Focus on failed or partial steps when debugging
- Compare successful runs with failed runs to spot differences